Difference between revisions of "Analytics Analysis (Crosstabs)"
Logan.Cate (talk | contribs) (added automapping failure section) |
Logan.Cate (talk | contribs) m |
||
| Line 3: | Line 3: | ||
There are two types of Analysis Crosstabs - regular Crosstabs and Link Group Crosstabs. | There are two types of Analysis Crosstabs - regular Crosstabs and Link Group Crosstabs. | ||
| − | Regular Crosstabs allow you to aggregate and explore data sets. For example, if you wanted to look at prescribing habits of the organization, you might have a Crosstab that includes the following: Medication, Prescribe Action (Record, Print, Retail, etc), | + | '''Regular Crosstabs''' allow you to aggregate and explore data sets. For example, if you wanted to look at prescribing habits of the organization, you might have a Crosstab that includes the following: Medication, Prescribe Action (Record, Print, Retail, etc), Prescribing Provider, Drug Therapy Class, Pharmacy, Patient State/City, and so on. You would be able to show the number of prescriptions by provider. Then filter out Recorded prescriptions and look at counts by year. You could then include all prescriptions and see the pharmacies that you send most of your prescriptions to. Crosstabs allow you to take a large data set and explore the information. |
| − | Link Group Crosstabs allow you to compare multiple data sets. For example, we could show, by provider, the number of patients on their panel (where they are the PCP), the number of diabetics in another column, the number of diabetics without an A1C in the past year in another, and the number of overdue tasks for that provider. With Link Group Crosstabs, we can show summary information on a common dimension for various types of data. | + | '''Link Group Crosstabs''' allow you to compare multiple data sets. For example, we could show, by provider, the number of patients on their panel (where they are the PCP), the number of diabetics in another column, the number of diabetics without an A1C in the past year in another, and the number of overdue tasks for that provider. With Link Group Crosstabs, we can show summary information on a common dimension for various types of data. |
==Distinct Counts== | ==Distinct Counts== | ||
Revision as of 14:45, 24 June 2011
Analysis, also known as Crosstabs, allows you to aggregate data with Analytics.
There are two types of Analysis Crosstabs - regular Crosstabs and Link Group Crosstabs.
Regular Crosstabs allow you to aggregate and explore data sets. For example, if you wanted to look at prescribing habits of the organization, you might have a Crosstab that includes the following: Medication, Prescribe Action (Record, Print, Retail, etc), Prescribing Provider, Drug Therapy Class, Pharmacy, Patient State/City, and so on. You would be able to show the number of prescriptions by provider. Then filter out Recorded prescriptions and look at counts by year. You could then include all prescriptions and see the pharmacies that you send most of your prescriptions to. Crosstabs allow you to take a large data set and explore the information.
Link Group Crosstabs allow you to compare multiple data sets. For example, we could show, by provider, the number of patients on their panel (where they are the PCP), the number of diabetics in another column, the number of diabetics without an A1C in the past year in another, and the number of overdue tasks for that provider. With Link Group Crosstabs, we can show summary information on a common dimension for various types of data.
Distinct Counts
When using Crosstabs, you may want to pull in distinct counts for items like patients. To do this, we need to setup an Expression to calculate the distinct values. Here's an example of how to count distinct patients.
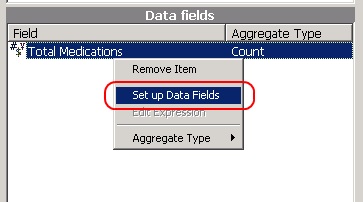
1) Once you have your Crosstab setup, right-click in Data Fields and select Set up Data Fields.
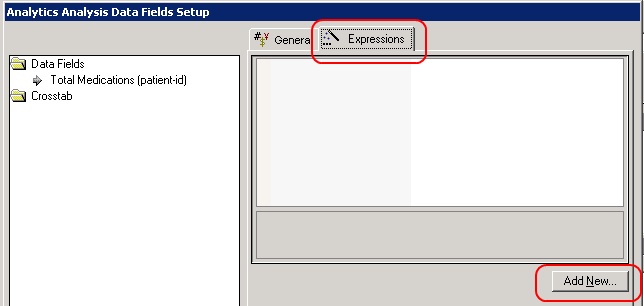
2) Select the Expressions tab, and click Add New...
3) When you are prompted to use existing fields, select No
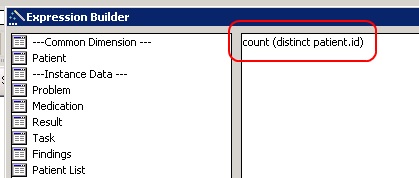
4) Create a new expression as "count ( distinct patient.id ) "
5) Name the field, click Parse and then click OK
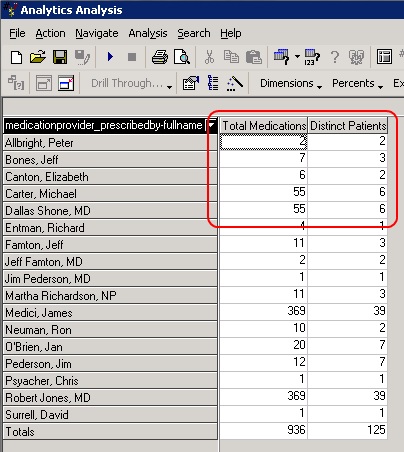
6) When you run the Crosstab again, you will see your distinct patient count
Link Group Automapping
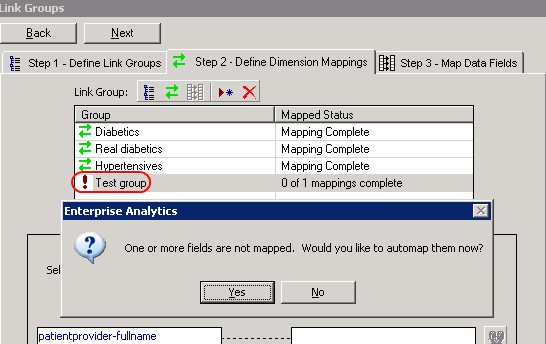
When creating a link group, it requires mapping fields between the crosstab and the link group. Normally this is accomplished with the Automap feature. Click on the group name and the following window should appear. Click yes.
If it doesn't map, manual mapping must be done. Click on the field; it should turn red.
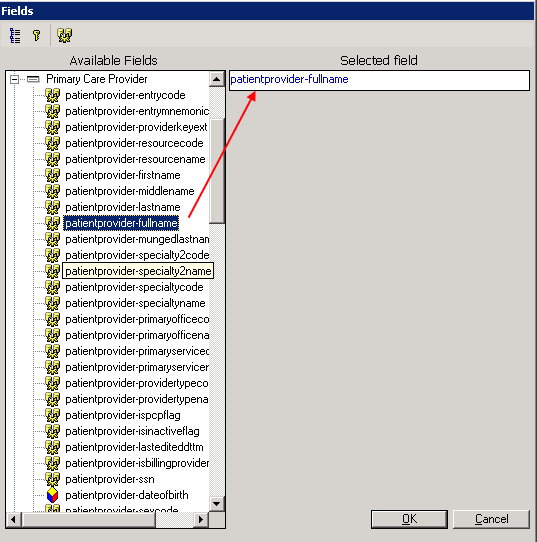
Click on the MetaLayer tree icon.
Find the field and double click; it should move to Selected field.
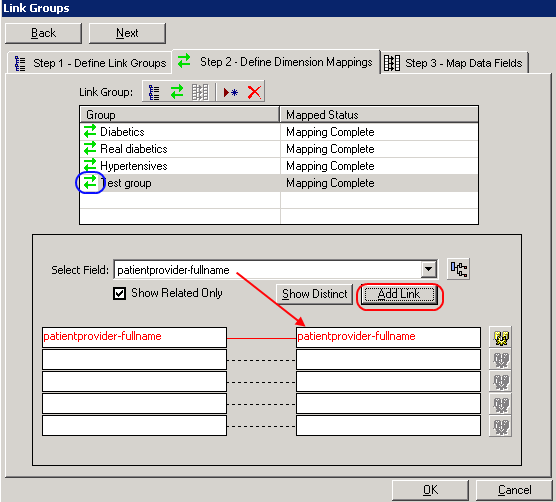
The field name will now show up in the link group window. Click Add Link and the field will move into the mapped area. Once this is complete, there should be two green arrows next to the link group name.
