Difference between revisions of "Analytics PXPTrace"
Logan.Cate (talk | contribs) (added section about process management; cleaned up article) |
Logan.Cate (talk | contribs) |
||
| Line 18: | Line 18: | ||
SQL can also be traced through the Process Management tool under the Administration tab. This works better for tracing problematic SQL that is using up server resources. | SQL can also be traced through the Process Management tool under the Administration tab. This works better for tracing problematic SQL that is using up server resources. | ||
| + | |||
[[Image:AST1.png]] | [[Image:AST1.png]] | ||
| + | |||
This is not as easy as using PXPTrace as not all processes show nor can they be traced simply by running. | This is not as easy as using PXPTrace as not all processes show nor can they be traced simply by running. | ||
To view the SQL associated with an Analytics process, click on the left row header to select the desired process. Then click on the SQL button on the top toolbar. | To view the SQL associated with an Analytics process, click on the left row header to select the desired process. Then click on the SQL button on the top toolbar. | ||
| + | |||
[[Image:AST2.png]] | [[Image:AST2.png]] | ||
| − | This will copy the code to the clipboard. Simply paste that into SSMS and run it. Debug as necessary; results will show when it's run. | + | |
| + | This will copy the code to the clipboard. Simply paste that into SSMS and run it. Debug as necessary; results will show when it's run. This example is a small crosstab. | ||
| + | |||
[[Image:AST3.png]] | [[Image:AST3.png]] | ||
Revision as of 15:52, 3 April 2012
Reports can be traced in Analytics through SQL Server Profiler, as well as Precision.xp Trace.
PXPTrace
PXPTrace tends to be a little simpler for non-DBAs to use.
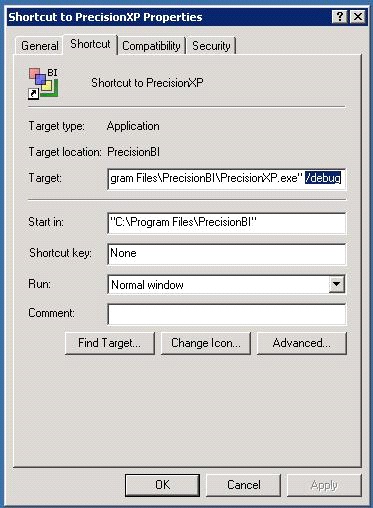
To use it, Precision.BI must be running in debug mode. To do this, create a shortcut that has " /debug" specified after the program file name:
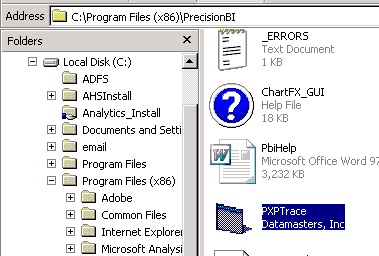
Next, launch PXPTrace, which may be found in the Precision.BI program files folder. This is typically C:\Program Files (x86)\PrecisionBI\ or C:\Program Files\PrecisionBI\.
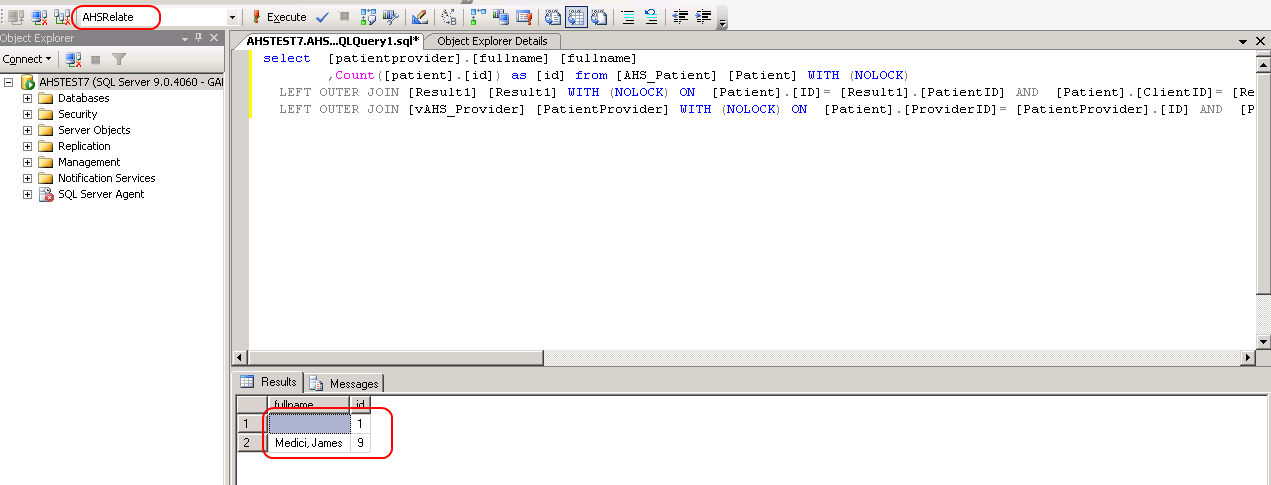
Copy the data from PXPTrace into SQL Server Management Studio and run it against the AHSRelate database. It will return the same data that would come up in Analytics. Note that it will track every action; keep actions to the bare minimum to produce the desired data for a given search or reporting object.
Process Management
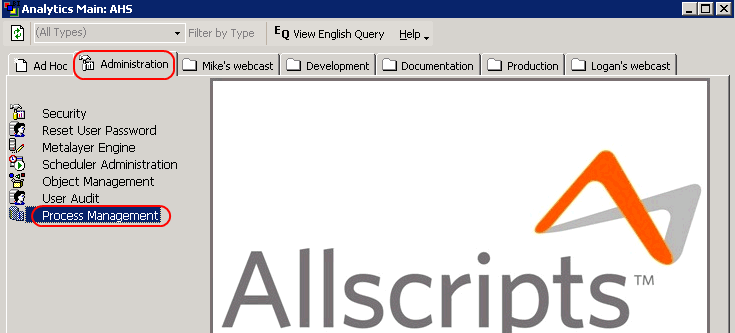
SQL can also be traced through the Process Management tool under the Administration tab. This works better for tracing problematic SQL that is using up server resources.
This is not as easy as using PXPTrace as not all processes show nor can they be traced simply by running.
To view the SQL associated with an Analytics process, click on the left row header to select the desired process. Then click on the SQL button on the top toolbar.
This will copy the code to the clipboard. Simply paste that into SSMS and run it. Debug as necessary; results will show when it's run. This example is a small crosstab.


