Difference between revisions of "Diabetics with Measures"
Logan.Cate (talk | contribs) |
Logan.Cate (talk | contribs) (updating formatting, sections, adding notes) |
||
| Line 1: | Line 1: | ||
'''WARNING''': Be sure to test all of the searches and confirm that the data returned is correct before building the main report. Codes used in this example may not work in others. | '''WARNING''': Be sure to test all of the searches and confirm that the data returned is correct before building the main report. Codes used in this example may not work in others. | ||
| + | |||
The example at the ACE 2013 Analytics User Group included active diabetic patients, and as subsets of that group, those whose most recent A1C value was above 8, those whose most recent blood pressure was above 140/90, and those whose most recent BMI was above 30. The crosstab also included some aggregation and percentages, as these tend to be the way the measures are structured. | The example at the ACE 2013 Analytics User Group included active diabetic patients, and as subsets of that group, those whose most recent A1C value was above 8, those whose most recent blood pressure was above 140/90, and those whose most recent BMI was above 30. The crosstab also included some aggregation and percentages, as these tend to be the way the measures are structured. | ||
| + | |||
| + | This is an example of what the finished crosstab will look like: | ||
[[Image:ACE01_-_finished_crosstab.png]] | [[Image:ACE01_-_finished_crosstab.png]] | ||
| Line 8: | Line 11: | ||
[[Image:ACE02 - a1c drillthrough.png]] | [[Image:ACE02 - a1c drillthrough.png]] | ||
| + | |||
| + | =Building the report= | ||
Building this report requires two types of objects: reports and searches. On the reports side, there is the crosstab and any drillthrough worksheets. The searches are numerous and each corresponds to a major part of determining our various patient groups. | Building this report requires two types of objects: reports and searches. On the reports side, there is the crosstab and any drillthrough worksheets. The searches are numerous and each corresponds to a major part of determining our various patient groups. | ||
| Line 29: | Line 34: | ||
There are combinations of these searches that may be used, as well as standard and nested versions. | There are combinations of these searches that may be used, as well as standard and nested versions. | ||
| − | These searches will be the base for all of the searches used in the report, though some searches will be nested and saved again during the building process. Building and testing these searches should be done in a worksheet to simplify the testing process. | + | These searches will be the base for all of the searches used in the report, though some searches will be nested and saved again during the building process. Building and testing these searches should be done in a worksheet to simplify the testing process. |
| + | |||
| + | One potential search addition looks for patients who have had an arrived appointment within a given time period back from the report date. See [[Allscripts_Analytics_Searches#Patients_with_Recent_Appointments|Recent Appointments]] for details on building this type of search. | ||
===Search Details=== | ===Search Details=== | ||
| − | '''Alive & Active''' - See [ | + | '''Alive & Active''' - See [[Allscripts_Analytics_Searches#Patients|Patient Searches]] for information on building the alive and active search. |
| Line 39: | Line 46: | ||
| − | '''A1C''' – This search looks for the most recent A1C results greater than or equal to 8. It uses the ''Result1-entrycode'' and ''result1-numericresult'' fields under the Result Multisearch section. The entrycode(s) | + | '''A1C''' – This search looks for the most recent A1C results greater than or equal to 8. It uses the ''Result1-entrycode'' and ''result1-numericresult'' fields under the Result Multisearch section. The entrycode(s) may differ across organizations. In the example, all codes including “A1C” were used. This may be restricted by the measure; follow any guidelines for the definition. Consulting with a clinical user may also be useful. |
| Line 53: | Line 60: | ||
==Reports== | ==Reports== | ||
| + | |||
| + | The example utilized one main crosstab and several drill-through worksheets to provide overview and detailed data. | ||
| + | |||
| + | === Crosstab === | ||
Building the report will involve a crosstab and multiple link groups. The patients will originally be divided by their primary care provider, but additional slice dimensions can be added at any point. Within the crosstab, there will be five patient groups: | Building the report will involve a crosstab and multiple link groups. The patients will originally be divided by their primary care provider, but additional slice dimensions can be added at any point. Within the crosstab, there will be five patient groups: | ||
| Line 128: | Line 139: | ||
Run the crosstab. The expressions should show the proper totals at the bottom. Save the crosstab. Once saved, the search can be associated to it. From the Search menu, select Add Searches to Object. Select the Active Diabetics search and click OK. | Run the crosstab. The expressions should show the proper totals at the bottom. Save the crosstab. Once saved, the search can be associated to it. From the Search menu, select Add Searches to Object. Select the Active Diabetics search and click OK. | ||
| + | === Drill-through worksheets === | ||
Adding drill-through worksheets requires building the worksheet separately and then adding it to the crosstab. One worksheet was built for looking at applicable A1C information, while the other contained basic patient information. The A1C worksheet contained the following data: | Adding drill-through worksheets requires building the worksheet separately and then adding it to the crosstab. One worksheet was built for looking at applicable A1C information, while the other contained basic patient information. The A1C worksheet contained the following data: | ||
Revision as of 14:41, 9 September 2013
WARNING: Be sure to test all of the searches and confirm that the data returned is correct before building the main report. Codes used in this example may not work in others.
The example at the ACE 2013 Analytics User Group included active diabetic patients, and as subsets of that group, those whose most recent A1C value was above 8, those whose most recent blood pressure was above 140/90, and those whose most recent BMI was above 30. The crosstab also included some aggregation and percentages, as these tend to be the way the measures are structured.
This is an example of what the finished crosstab will look like:
For detailed views, drill through worksheets were created and added to the crosstab. These are not required and may be added later as needed, but they can be very useful for checking data. Be aware that the fields used in the worksheet may affect the number of results seen.
Building the report
Building this report requires two types of objects: reports and searches. On the reports side, there is the crosstab and any drillthrough worksheets. The searches are numerous and each corresponds to a major part of determining our various patient groups.
Searches
The searches used in this report are as follows:
Alive & Active – used to remove deceased, inactive, and test patients
Active Diabetics – determines patients with active diagnosis of diabetes
A1C – determines patients with A1C results above a certain level
BP – determines patients with blood pressure findings above a certain level
BMI – determines patients with BMI findings above a certain level
A1C/BP/BMI – determines patients with any of the above criteria
There are combinations of these searches that may be used, as well as standard and nested versions.
These searches will be the base for all of the searches used in the report, though some searches will be nested and saved again during the building process. Building and testing these searches should be done in a worksheet to simplify the testing process.
One potential search addition looks for patients who have had an arrived appointment within a given time period back from the report date. See Recent Appointments for details on building this type of search.
Search Details
Alive & Active - See Patient Searches for information on building the alive and active search.
Active Diabetics – There are three parts to this search. The first is the ICD9 code. In the example, codes between 250.00 and 250.99 were used. The measure will define the codes necessary. The next two parts relate to making sure the problem is active. The fields used are problem-category and problem-problemstatusname. Both of these should be set to Active to prevent family history or completed problems from being included.
A1C – This search looks for the most recent A1C results greater than or equal to 8. It uses the Result1-entrycode and result1-numericresult fields under the Result Multisearch section. The entrycode(s) may differ across organizations. In the example, all codes including “A1C” were used. This may be restricted by the measure; follow any guidelines for the definition. Consulting with a clinical user may also be useful.
BP – This search looks for the most recent blood pressure findings above 140/90. It requires defining both the systolic and diastolic blood pressure types, and the corresponding values. The field finding1-entrycode will define the systolic code(s), while finding2-entrycode will define the diastolic code(s). The respective findingX-numericresult fields will define the actual blood pressure values. My example used BP SYS and BP DIAS to define the entrycodes; some systems may have sitting/standing/lying values as well. These should be included using the OR operator. Finding1-numericresult was set to >= 140 and finding2-numericresult was set to >= 90.
BMI – This search is similar to the blood pressure search. It will use the finding1-entrycode and finding1-numericresult fields, substituting AHSBMICalc as the entrycode value. Using Show Distinct Values on finding1-entrycode may make finding the right code(s) easier. For finding1-numericresult, this was set to >= 30.
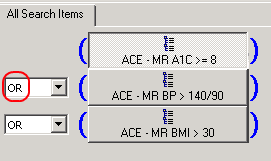
A1C/BP/BMI – The three result searches were combined into a single search to determine the number of patients who met at least one of the three criteria. To do so, each search had to return patients rather than results, and this requires nesting each search. Patient-id can be used for the field mappings. Once all three are nested, be sure to change the operator to OR so patients only have to meet one criteria.
Reports
The example utilized one main crosstab and several drill-through worksheets to provide overview and detailed data.
Crosstab
Building the report will involve a crosstab and multiple link groups. The patients will originally be divided by their primary care provider, but additional slice dimensions can be added at any point. Within the crosstab, there will be five patient groups:
- Active diabetics
- Active diabetics with most recent A1C above eight
- Active diabetics with most recent blood pressure above 140/90
- Active diabetics with most recent BMI above 30
- Active diabetics with any of the three criteria
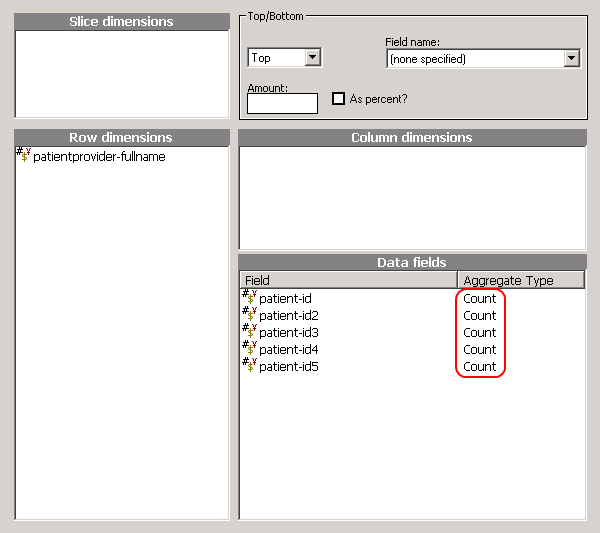
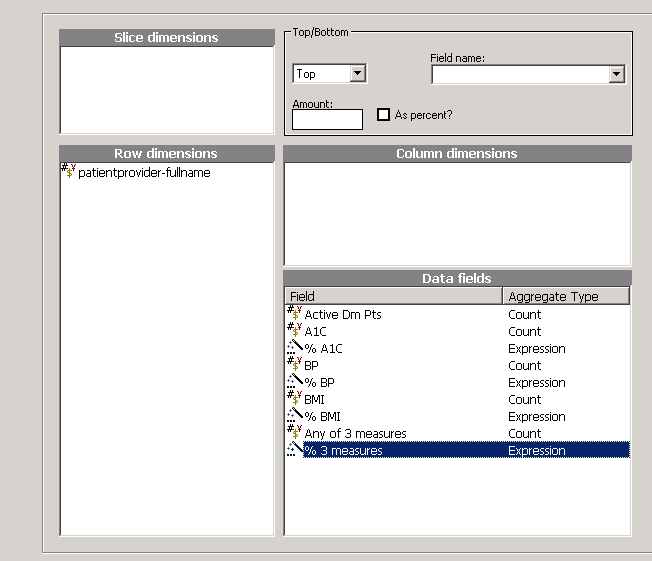
Add the primary care provider field to the Row Dimensions and add five patient-id fields to Data Fields. Be sure to change the Aggregate Type to Count for all patient-id fields.
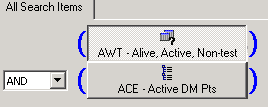
From the search menu, create a new search. Stack the Alive & Active search. Nest the Active Diabetics search, using patient-id as the mapping link. It should look similar to this when complete:
Save the search as it will be associated to the crosstab later.
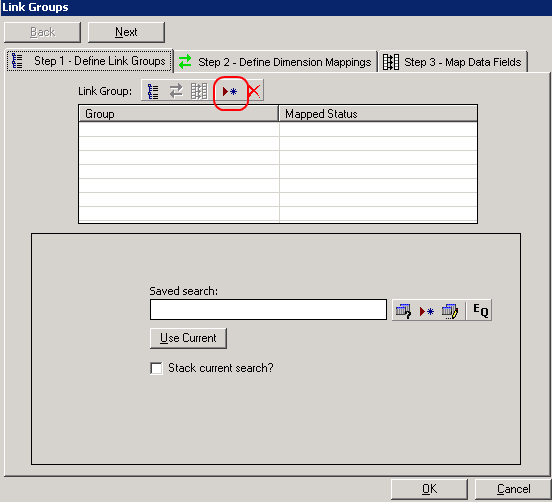
Click on the Link Group button in the toolbar.
Link groups will be created for patient groups associated with each result and the combination of all results. Click the new link group button
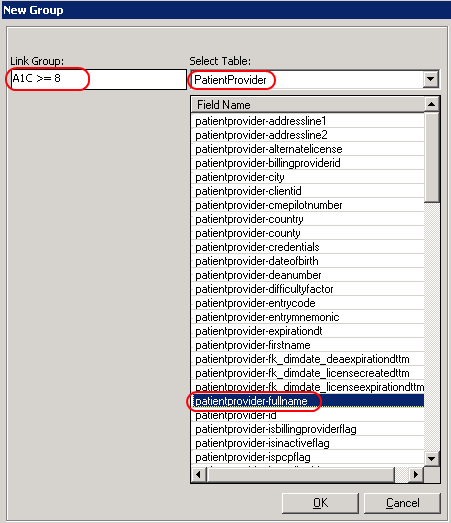
Give the link group a name that will allow easy identification and pairing with a search. Under the Select Table dropdown menu, find PatientProvider. From the fields list below, select patientprovider-fullname. This matches the row dimension field selected in the crosstab and will make field mapping easier. Click OK.
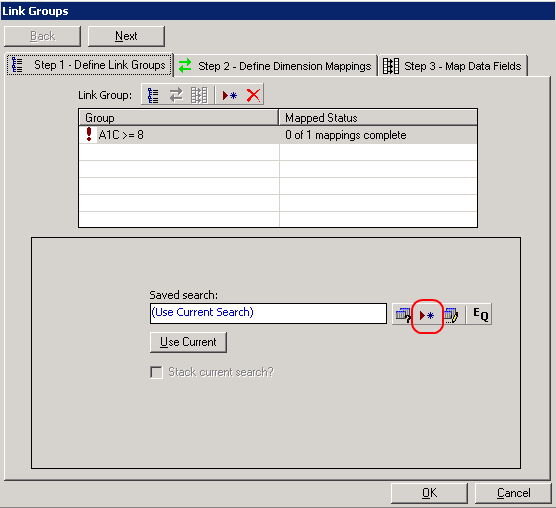
In the Link Groups window, the new group will show above. To add a search to this link group, click the new search button.
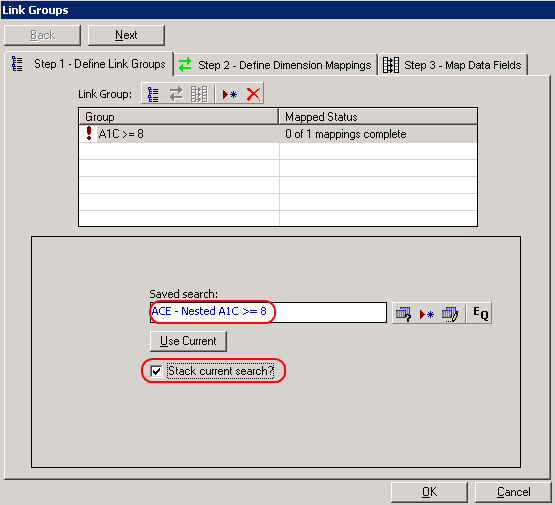
To identify only the unique patients, this search will need to be nested. Create a new nested search, select the proper subsearch, and map the two. Save the search and return to the link groups window. Check the Stack current search button; this will add the Active Diabetics search to the result search.
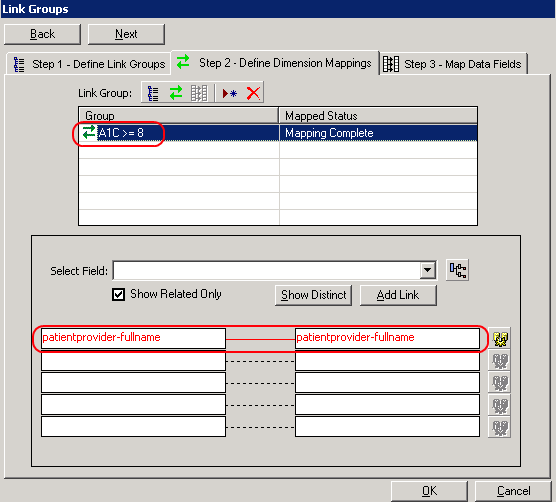
Click on the step 2 tab. Click the link group name to attempt the automapping feature. It should map automatically if the row dimension field matches the field selected when the link group was created. If it doesn’t automap, follow the directions here: Link group mapping.
When the mapping is complete, the fields will match and the status will say Mapping Complete. Green arrows will show up next to the group name. Click on the step 3 tab.
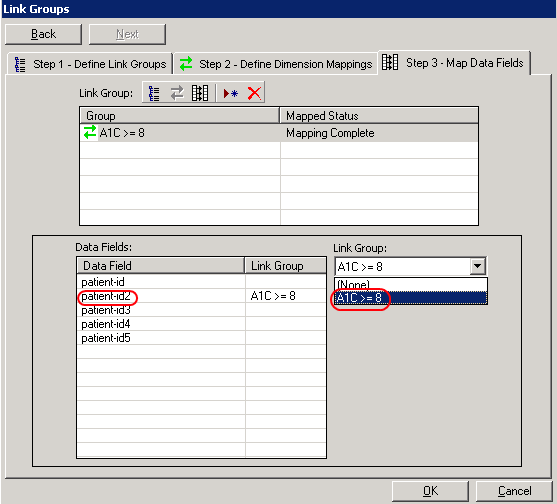
Select the patient-id2 field; this is going to be tied to the first link group. Use the Link Group dropdown to select the group. Note that the patient-id field will be reserved for the Active Diabetics search. When completed, the link group name should appear next to patient-id2.
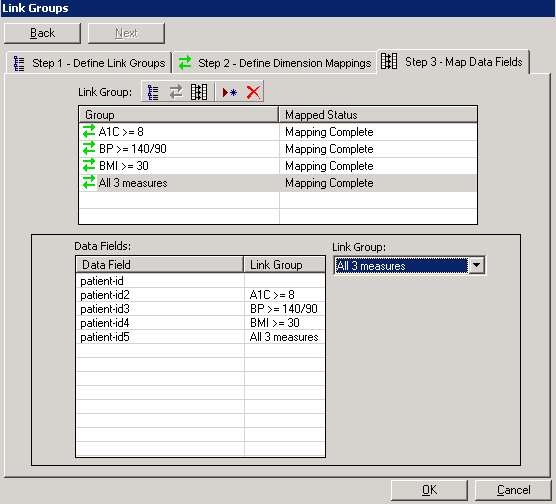
Repeat the link group steps for the other three link groups. When complete, it should look something like this:
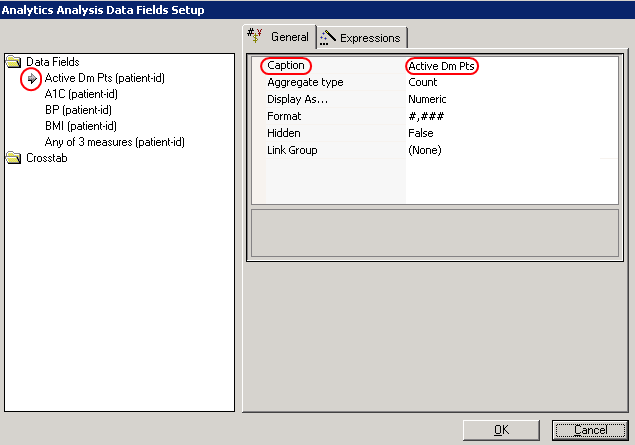
Click OK to return to the crosstab. It’s recommended to rename the patient-id fields for easier identification once the crosstab has been run. Click the Set up Crosstab button.
For the selected data field on the left, the caption can be changed on the right. An arrow points to the currently active data field.
To add percentages to a link group crosstab requires building expressions. Click the expression builder button and select Yes when prompted.
The formula for the percentage is quite simple: the smaller patient group divided into the larger group. Double click the appropriate fields from the left, adding in the divide by between them. Add a caption and format as desired. Click OK.
Do this for each group. Make sure to change the aggregate type (on the crosstab) from Sum to Expression. Moving the percentages to be adjacent to the link groups will make it easier to view when the crosstab is run.
Run the crosstab. The expressions should show the proper totals at the bottom. Save the crosstab. Once saved, the search can be associated to it. From the Search menu, select Add Searches to Object. Select the Active Diabetics search and click OK.
Drill-through worksheets
Adding drill-through worksheets requires building the worksheet separately and then adding it to the crosstab. One worksheet was built for looking at applicable A1C information, while the other contained basic patient information. The A1C worksheet contained the following data:
- Patient name
- MRN
- DoB
- Primary care provider
- A1C type
- A1C date
- Most recent arrived appointment
The A1C fields are results multisearch and the appointment field is an expression. When using a drill-through worksheet with a nested search, filtering must be done on the results field to only show A1C values. In this case, a parameter was used. See this page for information on adding a parameter: Parameters
The expression for the most recent arrived appointment is as follows:
(
SELECT MAX (E.EncounterDTTM)
FROM AHS_Encounter e
WHERE e.EncounterTypeName = 'Appointment'
AND e.AppointmentStatusName = 'Arrived'
AND e.PatientID =  [patient].[id]
)
Once the worksheet is saved, it can be added to the crosstab. Open the diabetes crosstab and in the Analysis menu, there is an option for Add/Remove Drillthrough Worksheets. Select that option, click the Add button, and select the appropriate worksheet. Repeat as necessary until all desired worksheets have been added. Save the crosstab. It is now possible to view detailed information about individual patient groups from the crosstab.


