Difference between revisions of "Rhapsody Management Console"
Jump to navigation
Jump to search
(Created page with "600px| • Web-based application, which enables you to sort, view, edit and re-send messages. • Monitor system logs and error conditions. • The first ...") |
|||
| Line 23: | Line 23: | ||
:- By clicking the Rhapsody Management Console button under the view dropdown menu in the Rhapsody IDE or the Toolbar in IDE | :- By clicking the Rhapsody Management Console button under the view dropdown menu in the Rhapsody IDE or the Toolbar in IDE | ||
| − | |||
| − | |||
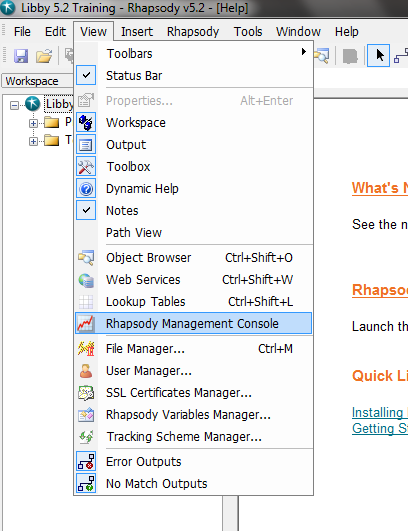
| − | File:rmc5.png|Toolbar | + | [[File:rmc4.png|left|Dropdown Menu]] |
| − | + | ||
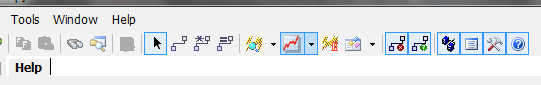
| + | [[File:rmc5.png|center|Toolbar]] | ||
Latest revision as of 19:29, 27 June 2013

• Web-based application, which enables you to sort, view, edit and re-send messages.
• Monitor system logs and error conditions.
• The first point of reference when a problem with message processing occurs.
• Manage lookup tables, watchlists, and error queues.
• Set up archiving, notification settings, and reporting statistics
• There are three ways to access the Rhapsody Management Console:
- - By entering “server:port/rhapsody” into the URL bar of your internet browser

- - By right clicking on the Rhapsody Service Monitor

- - By clicking the Rhapsody Management Console button under the view dropdown menu in the Rhapsody IDE or the Toolbar in IDE

